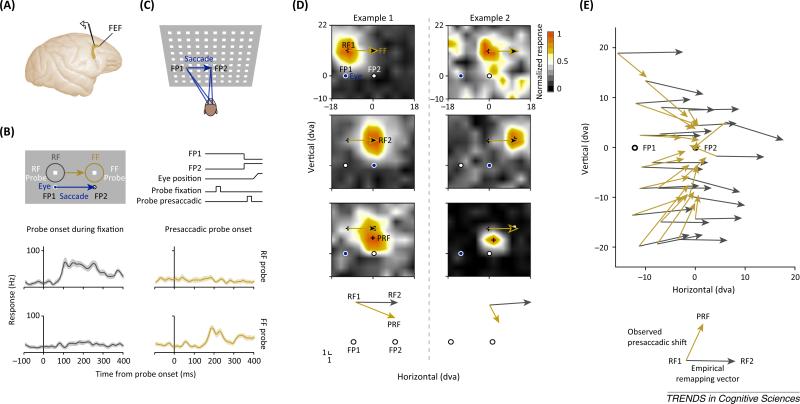
Figure 2.
Receptive field (RF) shifts in the frontal eye field (FEF). (A) Electrophysiological recordings in the macaque FEF. (B) Stimulus layout and timeline as used in [8] together with the responses of a FEF neuron. Responses to probes presented long before a saccade, and during fixation at fixation point 1 (FP1) are plotted in grey. Responses to probes shown shortly before a saccade are plotted in gold. FF stands for ‘future field’. (C) Stimulus layout used in [13]. (D) Two example RFs from [13]. RF1s (top) denote the RF centers measured during fixation at FP1, and long before a saccade. RF2s (middle) denote the RF centers measured during fixation at FP2, long after a saccade. The presaccadic RFs (PRFs) (bottom) denote the RF centers measured immediately before a saccade from FP1 to FP2. The gold vectors indicate the predicted remapping vector based on the RF1 centers (black crosses). The white squares represent the predicted remapping RF center based on the RF2s. (E) Population RF centers of all measured FEF RFs plotted as a function of visual space from [13]. Gray vectors are based on the differences between the RF1s and the RF2s and provide an empirical estimate for remapping. Gold vectors are based on the RF1s and PRFs.

