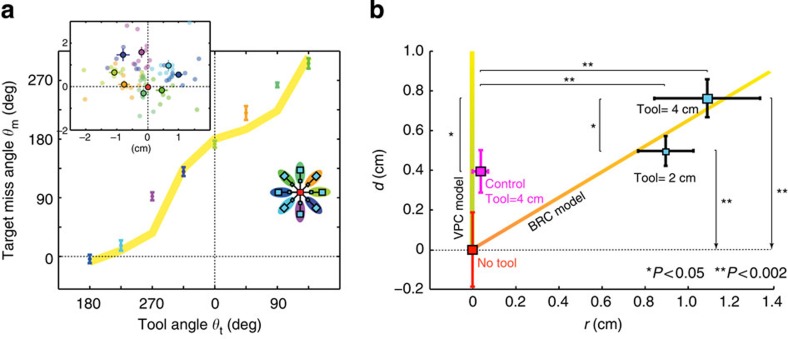
Figure 6. THR experimental models and data.
The model predictions have been replotted with the experiment data superimposed on top. (a) The inset shows the individual subject data averaged over the targets with the colour code representing the tool angle and the large circles representing the across subject average. The data is plotted relative to the mean no-tool reach positon (red plot on inset origin). The target miss angle of the collected data (from the inset) is plotted (different colours correponding to the colour code) over the BRC model prediction of the miss angles (yellow trace in a). The experiment data matched the model well, though there was a small but significant difference for three tool orientations (two-tailed t-tests, T(8)>2.35, P<0.05 for θm=45, 90, 270). (b) The ratio of the overshoot (d) is plotted against the deviation (r) from the experiment matched with the BRC model (orange–yellow trace) for both the 2-cm tools and 4-cm tools (two-tailed t-test gave T(8)=0.05, P=0.96) and 4-cm tool (T(8)=0.34, P=0.70). On the other hand, the miss behaviours were significantly different from the VPC model (green–yellow) both for the 2-cm tool (T(8)=7.03, P=10−4, two-tailed t-test relative to the y axis) and 4-cm tool (T(8)=4.44, P=0.002, two-tailed t-test relative to the y axis). The data from the control THR experiment is plotted in pink. Radial deviation was absent in the control task (two-tailed t-test for the difference of r values from zero; T(9)=1.17, P=0.27). A target overshoot was observed (T(9)=3.71, P=0.0048, two-tailed t-test) in the control but it was less than the THR experiment for the same tool length (two-sample two-tailed t-test between the r values from Control and THR experiments; T(17)=2.66, P<0.017). Error bars represent s.e.

