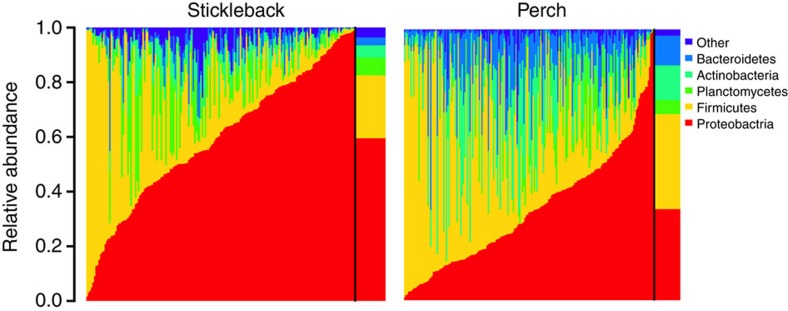
Figure 1. There is substantial among-individual heterogeneity in gut microbiota composition within stickleback and perch populations.
Columns represent the relative abundance of microbial phyla within individual hosts, and population mean abundance to the right of the black line. In stickleback, Proteobacteria ranged from 1.6 to 98.9% of individuals’ microbiota (mean=57%; 1.1–99.8% in perch). Similar among-individual variation is observed at lower taxonomic ranks (for example, among classes within a phylum). This heterogeneity among individuals is particularly striking, given the strong similarity in mean microbiota composition between stickleback and perch (Fig. 2).

