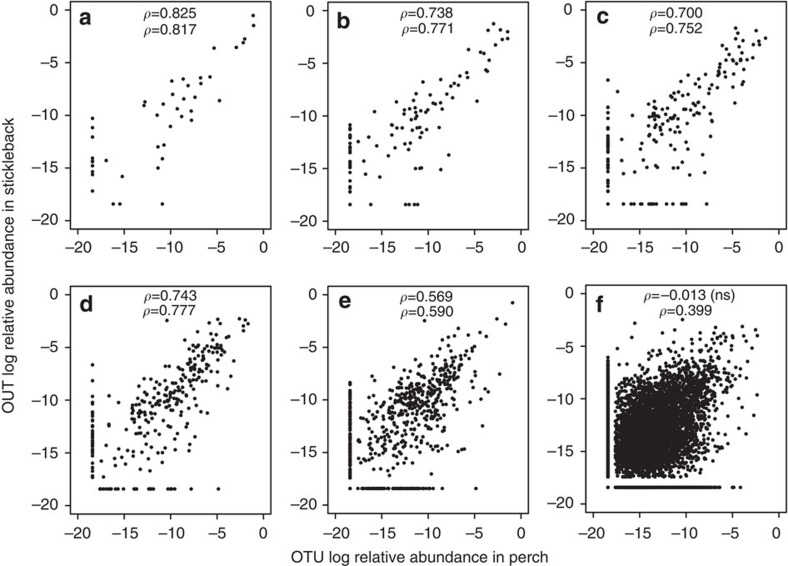
Figure 2. Microbial taxon relative abundance is correlated between perch and stickleback.
For (a) phyla, (b) classes, (c) orders, (d) families, (e) genera and (f) all OTUs. Spearman rank correlations are provided for each taxonomic level (top value: all taxa, bottom: shared taxa), all P<0.00001 except f. To plot taxa absent in one host, a small value was added to all frequencies before log transformation. Complete information on taxonomic composition, relative abundance and prevalence are provided in Supplementary Data 1.

