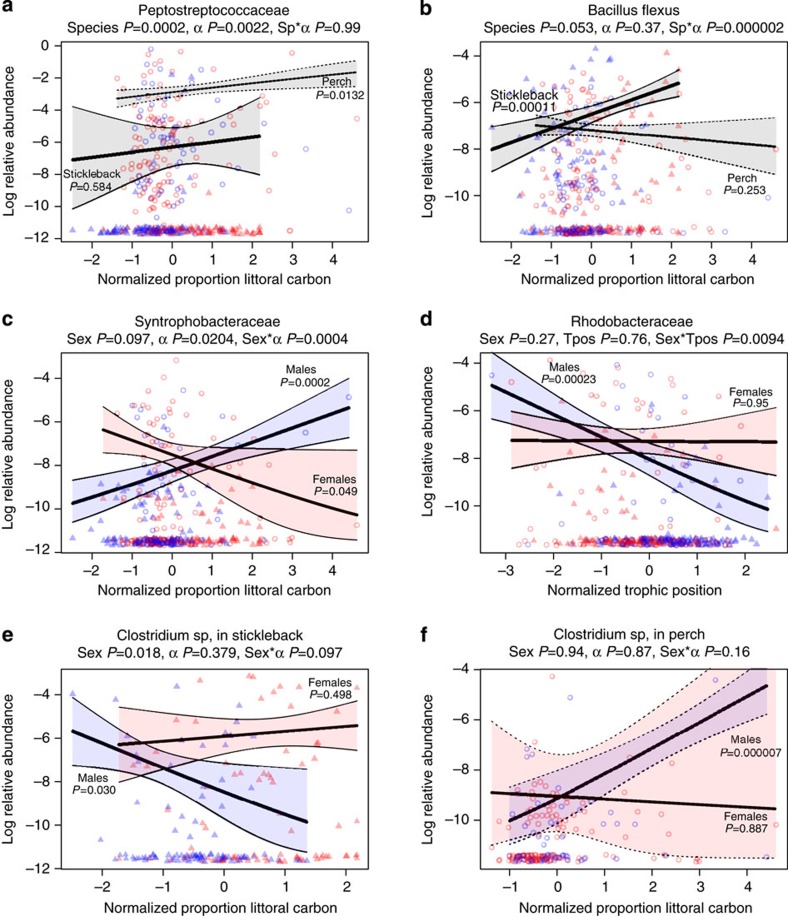
Figure 3. Selected examples of microbial OTU responses to diet.
Triangles and open circles represent stickleback and perch, respectively. Red/blue indicates females and males. Lines represent quasibinomial GLM estimates with confidence intervals (coloured by sex, grey if combining sexes). GLM estimates of P-values for model terms are included next to trend lines or in panel headings. Headings indicate the lowest known taxonomic identity of the OTU. OTUs presented here were chosen to illustrate several distinct patterns: (a) overall effect of α in both host species for an OTU in the Peptostreptococcaceae. There is also a host species effect (P=0.0002), but no interaction effects as diet has parallel (albeit not equally significant) effects in each host. Overall, 11.3 % of abundant OTUs exhibited a main effect of α across both hosts (11.5% for tpos). This represents a unique demonstration that environmental effects on the microbiota can be (weakly) extrapolated from one host species to another. (b) A species-specific effect of carbon source on Bacillus flexus abundance in stickleback but not perch, underlying a significant species*diet interaction (P=0.0001). This OTU also exhibits a sex*species interaction because B. flexus is more abundant in stickleback males than in females (P=0.000014), whereas it shows a nonsignificant tendency to be more abundant in female than male perch (P=0.0954). Neither species exhibits a significant sex*α interaction. (c) A sex-specific carbon effect on a Syntrophobacteraceae OTU, which is more abundant in littoral males (P=0.049) and in pelagic females (P=0.0002) regardless of host species. (d) Sex-specific trophic position (tpos) effect in which a Syntrophobacteraceae OTU is more common in low trophic position males (P=0.00023), regardless of host species, but is insensitive to trophic position in females (P=0.95). (e,f) A sex*carbon*species interaction on Clostridium sp abundance, which exhibits opposite diet effects in male stickleback versus male perch (more common in pelagic male stickleback P=0.03, and in littoral male perch P=0.000007), but is independent of female diet in both hosts.

