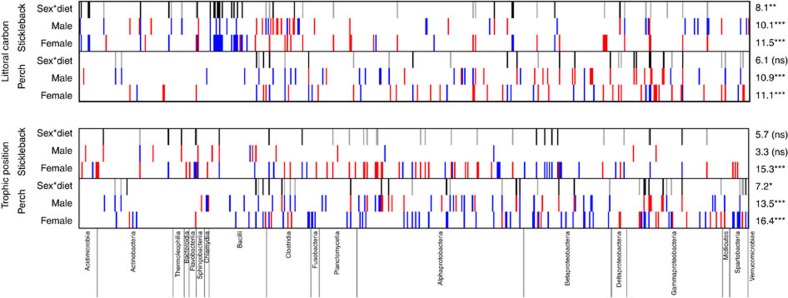
Figure 6. The relative abundances of some microbial OTUs depend on an interaction between sex and diet, in both perch and stickleback.
The top heatmaps represent how OTUs covary with host individuals’ proportional reliance on littoral carbon (α). The bottom heatmaps represent the effects of host trophic position on OTU abundance. Each column represents one of the 566 abundant OTUs (averaging >0.01% relative abundance), arranged by taxonomic group (names of classes are provided along the bottom of the figure). Within each heatmap, rows with red/blue bars indicate the effect of a given diet measure on individual OTUs for (from top to bottom) male stickleback, female stickleback, male perch and female perch. Thin vertical red bars indicate OTUs whose relative abundance decreases significantly (P<0.05) with the diet metric in a quasibinomial GLM for the focal host species and sex. Blue bars indicate OTUs whose relative abundance increases with the diet metric (a ‘positive’ effect). For each diet measure and species, we also include a row indicating OTUs with significant sex*diet interaction effects in the GLM. Black bars represent OTUs with more positive diet effects in females than males. This can arise, for example, when (i) an OTU is more abundant in high tpos females (positive effect) and unresponsive to tpos in males (no effect), (ii) when an OTU is unresponsive to tpos in females (no effect) but decreases with tpos in males (negative effect), or (iii) when an OTU changes with tpos in both sexes but exhibits a more positive slope in females. Grey bars represent OTUs with more positive diet effects in males than females. On the right side of the figure, we indicate the percentage of the abundant OTUs that exhibit significant main effects of diet within each host sex/species combination, or that exhibit sex*diet interactions. Asterisks indicate whether this percentage significantly exceeds the 5% expected from false positives (*P<0.05; **P<0.01; ***P<0.001).

