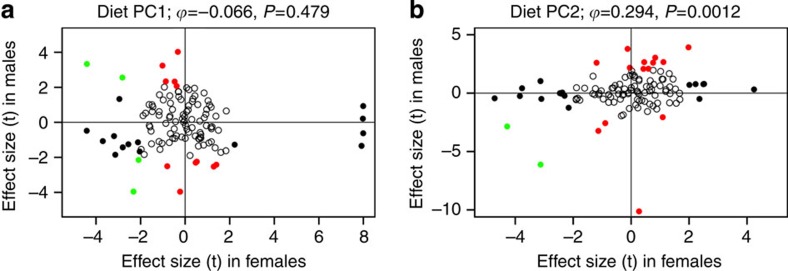
Figure 8. Comparison between male and female diet effects on the human gut microbiota.
Diet is measured here by the top two principal component axes of detailed nutritional data from Wu et al.15, see Supplementary Data 3 for PC loadings to interpret these axes. Diet effects are uncorrelated (A: diet PC1) or weakly positively correlated (B: diet PC2) between males and females. Each point represents the female and male diet effect on one of the 125 most abundant OTUs (>0.1% mean relative abundance). Diet effect is measured as a t-statistic, scaling the slope of OTU relative abundance versus diet PC score (calculated in a sex-specific quasibinomial GLM), by the s.e. of that slope. Open points are not statistically significant (P>0.05). Black points are significant in females, red significant in males and green points are significant in both. Horizontal and vertical lines visually distinguish OTUs with positive effect estimates in both sexes (top right quadrant), or negative effects in both sexes (bottom left), or opposite effects in males versus females (top left or bottom right). Spearman rank correlation tests are provided above each panel.

