
Figure 3. Induction of autophagy by dual PI-3K/mTOR inhibitors.
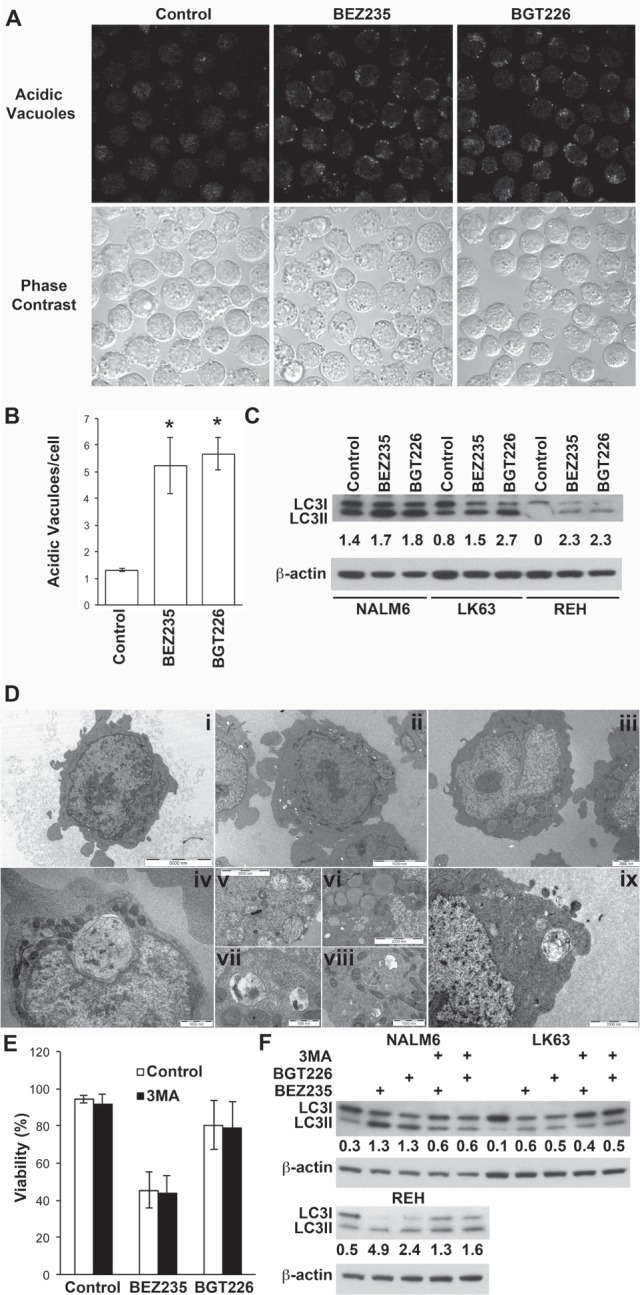
(A) NALM6 cells were treated with BEZ235 or BGT226 for the indicated time and stained for acid vacuoles (AV) using lysosensor blue. The upper panel shows lysosensor blue staining while the lower panels phase bright images of the same field of view. (B) Quantitation of AV from figure 4A. The mean ± SE of two experiments is shown. A minimum of 75 cells was assessed for each condition in each experiment. *P<0.05. (C) Western blot of LC3 in ALL cell lines treated with vehicle, or 0.2 μM BEZ235 or BGT226 for 16 h. The ratio of LC3II to LC3I is shown. (D) Electron micrographs of NALM6 cells treated with vehicle (i), BEZ235 (ii, iv, v, vi and vii) or BGT226 (iii, viii and ix). Magnification bars are shown. (E) NALM6 cells were treated with BEZ235 or BGT226 with or without the addition of 5 mM 3MA for 16 h and assessed for viability. The mean±SD of 3 independent experiments is shown. (F) The indicated cell lines were treated as for E and lysates analyzed for LC3.