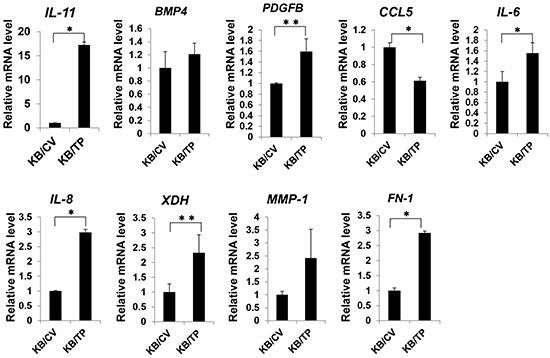
Figure 5. Expression of NFκB target genes.

Total RNA was extracted from KB/TP and KB/CV cells (overexpressing or lacking TP, respectively), and relative transcript expression levels of the NFκB target genes IL-11, BMP4, PDGFB, CCL5, IL-6, IL-8, XDH, MMP-1, and FN-1 were measured using real-time PCR. Each column and bar represents the mean ± SD. *P < 0.01, **P < 0.05.
