
Figure 2. TGF-β signaling activation during the RIP1-Tag2 angiogenic switch.
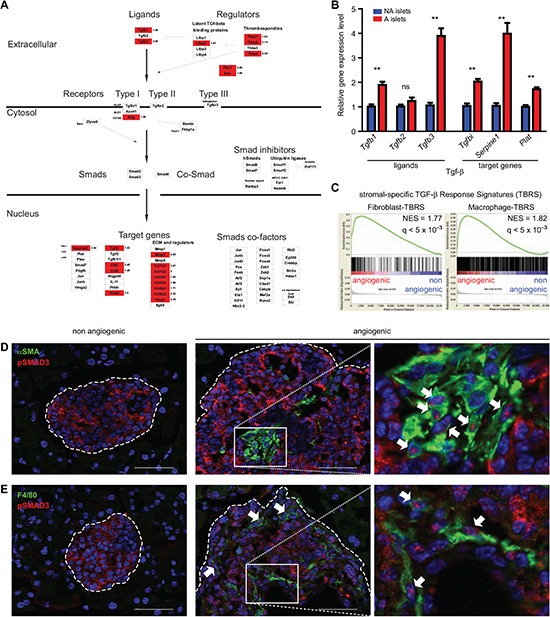
(A) schematic depiction of gene expression profiling data on a TGF-β signaling GenMapp. Genes (represented by boxes) in red indicate genes significantly up-regulated in angiogenic islets. No gene in this pathway was down-regulated. Several TGF-β ligands, extracellular regulators, the Endoglin co-receptor (Eng, encoding CD105), together with target genes are up-regulated in angiogenic islets. (B) RT-qPCR analysis of TGF-β ligands and target gene expression in non angiogenic (blue) and angiogenic (red) islets. The Tgfb1 and Tgfb3 genes are significantly up-regulated in angiogenic islets together with the prototypical Smad2/3 target genes Tgfbi, Serpine1 and Plat. Measures represent the mean of two independent experiments, error bars the SEM, ** p < 5×10⁻³, ns not significant. (C) GSEA demonstrates significant enrichment of fibroblast- and macrophage- specific TGF-β response signatures in the transcriptome of angiogenic islets. The Normalized Enrichment Score (NES) and the FDR q-value assessing the significance of enrichment are indicated. (D-E) co-staining of phosphorylated SMAD3 (pSMAD3) with αSMA (D) or F4/80 (E) in RIP1-Tag2 islets. Nuclear localization of pSMAD3 is observed in angiogenic islets, predominantly in tumor-associated αSMA+ fibroblasts (D) and F4/80+ macrophages (E) (arrows). Nuclei are stained in blue (DAPI). Dashed lines encircle islets; non angiogenic: left column, angiogenic: middle column and higher magnification pictures corresponding to the boxed areas within angiogenic islets are presented (right column). Scale bars, 50 μm.