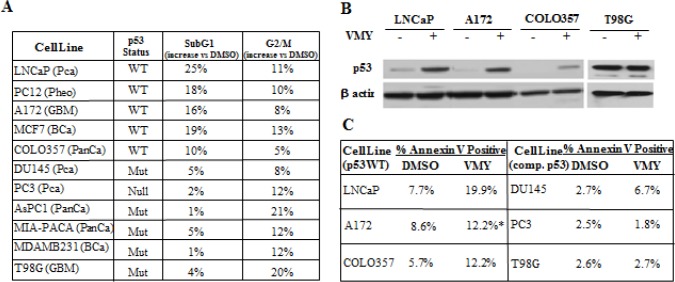
Figure 1. VMY activity in multiple cancer cell lines.
(A) The p53 status as well as the percent increases in the SubG1 and G2/M subpopulations of cells treated with 30 uM VMY for 18hrs versus DMSO are shown. Changes in cell cycle profile were assessed by flow cytometry. LnCaP and MCF7 cells and DU145 and MDAMB231cells were used as positive and negative controls, respectively, for VMY induction of cell death as previously reported [26, 28]. (B) Western blot establishing the induction of p53 protein levels by exposure to 30 uM VMY for 18hrs in the p53 wild-type human cell lines, A172 and COLO357 but not in the p53 mutant cell line T98G. LnCaP cells were used as a positive control for p53 induction as previously shown [26]. (C) Annexin V positivity as measured by flow cytometry on cells with wild-type or compromised p53 (comp. p53) followed by exposure to DMSO or 30 uM VMY for 18hrs (* 40 hours for A172). PCa, prostate cancer, Pheo, pheochromocytoma, GBM, glioblastoma multiforme, BCa, breast cancer, PanCa, pancreatic cancer.

