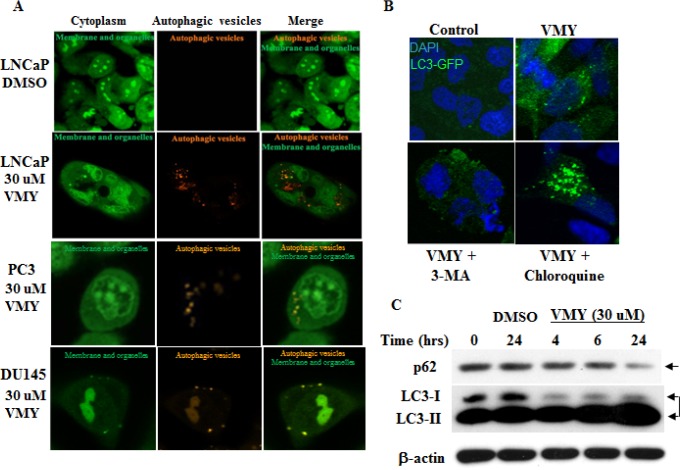
Figure 5. VMY induces autophagic activation in LNCaP cells.
(A) Photomicrographs of LNCaP, PC3 and DU145 cells stained with acridine orange (AO) and treated for 18 hrs with DMSO (top row, LNCaP) or 30 uM VMY (bottom rows). The cells were imaged on a Zeiss LSM510 Meta microscope using a 488 nm dichroic mirror and a 525/50 bandpass filter to visualize cytoplasmic- and membrane- associated AO (green, left panels) and a 700 nm short pass filter using a metadetector of 651/42 emission filter to visualize protonated AO in acidic vesicles (orange, middle panels) and as merged images (green and orange, right panels). (B) LNCaP cells were transiently transfected with LC3-GFP and treated with DMSO (top left) or VMY (top right) in the presence or absence of 5 uM 3-MA (an inhibitor of early autophagy, lower left) or 50 uM chloroquine (an inhibitor of acidification of lysosomes and autophagosomes, lower right). (C) Authophagy time-course experiments performed on LNCaP cells treated with 30 uM VMY for 4, 6 and 24 hrs. Western blotting was performed to determine the levels of the autophagic cargo receptor, p62 (arrow) and for the relative abundance of LC3I and LC3II (double arrow). β-actin was used as a loading control.

