
Figure 6. Temporal profile of autophagy induction in LNCaP cells by VMY.
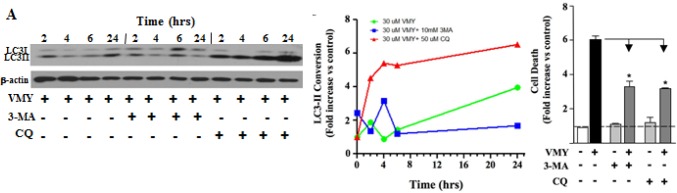
An extensive assessment of autophagic progression was performed at the times indicated in the presence or absence of the autophagy inhibitors 3-methyladenine (3-MA) and chloroquine (CQ). (A) Induction of autophagy was assessed following treatment with 30 uM VMY. (B) Quantification of normalized protein levels for LC3-II conversion was performed using the protein expression data in DMSO control treated cells (see Supplemental Fig. S2), following normalization to β-actin, allowing the effects of VMY and the independent effects of DMSO, 3-MA or CQ to be directly compared based on the results seen in A. The data were plotted as fold change in LC3-II. (C) Effect of inhibition of autophagy on VMY-induced cell death. The fold-increase in cell death induced by VMY in LNCaP cells in the presence or absence of 3-MA or chloroquine was quantified by trypan blue dye exclusion (* p < 0.01, N=3).