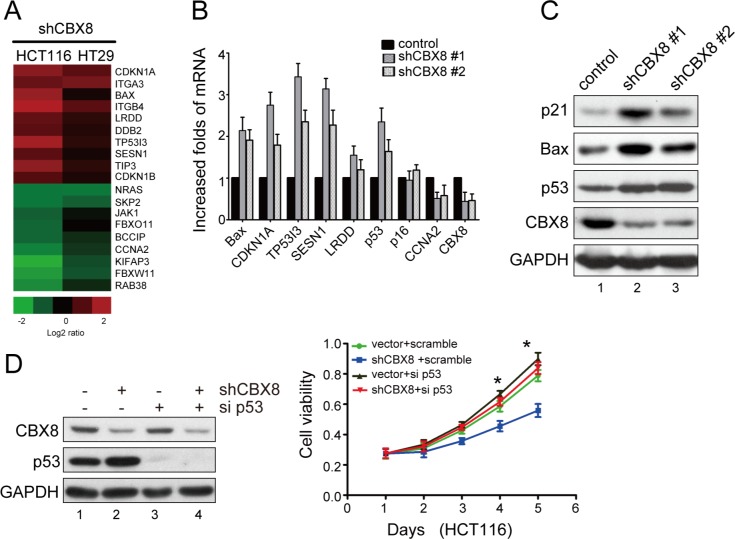
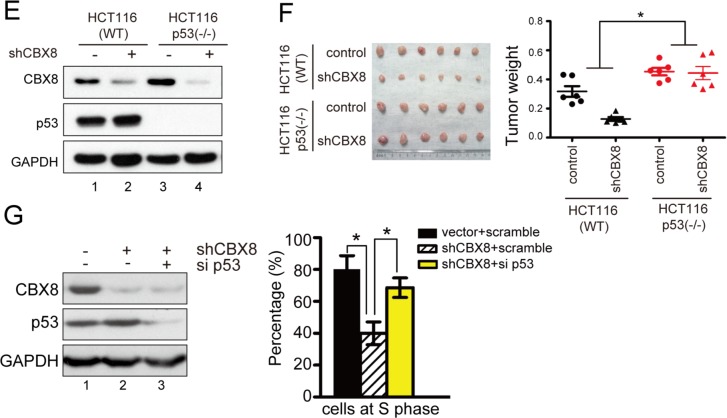
Figure 2. The cell proliferation inhibition after CBX8 knockdown was mostly dependent on p53.
(A) Gene expression profiles with the stable knockdown of CBX8 in HCT116 and HT29 cells as indicated. (B) The relative mRNA levels of the indicated genes normalized to GAPDH levels in the indicated cell lines were determined by qRT-PCR (mean ± SD of triplicate samples are shown). (C) The proteins in the indicated cell lines were analyzed by Western blotting. (D) Cell viability and the proteins in HCT116 cells treated as indicated were analyzed by MTT (right panel) and Western blotting (left panel), respectively. The dots represent the means, and the bars indicate the SD. *p < 0.05 using independent Student t test (n=3). (E, F) The in vivo growth of the indicated stable cell lines was examined as described in the Materials and Methods. The proteins in the indicated cells were analyzed by Western blotting (E). The images and weight of xenograft tumors are shown in the left and right side of F, respectively. The dots represent the weights, and the bars indicate the SD. *p < 0.05 using the independent Student t test (n=6). (G) HCT116 cells under the indicated conditions were synchronized at G1/S boundary by double thymidine block and released for 3 hours to proceed into S phase, as described in the Materials and Methods. The proteins in the indicated conditions were analyzed by Western blotting (left panel), and the percentages of cells at S phase are shown (right panel). The results are expressed as the mean ± SD of three independent experiments, *p < 0.05.


