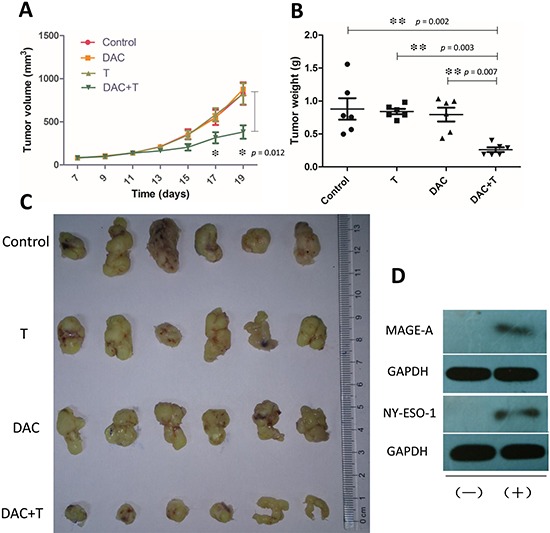
Figure 5. Effects of in vivo treatment on osteosarcoma.

(A) Tumors were measured with caliper every two days, starting on the 7th day. Treatment with DAC was administrated from the 7th day to the 11th day, and mice started to receive i.v. injection of CTA specific T-cells every two days from the 12th day. In mice pre-treated with DAC, T-cells represented high efficiency in inhibiting tumor growth. Statistical difference in tumor volume was shown the 17th day, while there was no statistical difference among the other 3 groups. (B) Weights of the xenografts from (C) on the 19th day. (C) Xenografts excised from the tumor bearing mice on day 19. (D) Western blot showed that expression of MAGE-A and NY-ESO-1 was elevated after in vivo treatment with DAC. (+) : Treated with DAC; (−) : Without DAC treatment. Error bars in (A) and (B) refer to Standard Error of Mean.
