
Figure 8. Expression level of MTDH in HGSOC samples correlates with prognosis of patients.
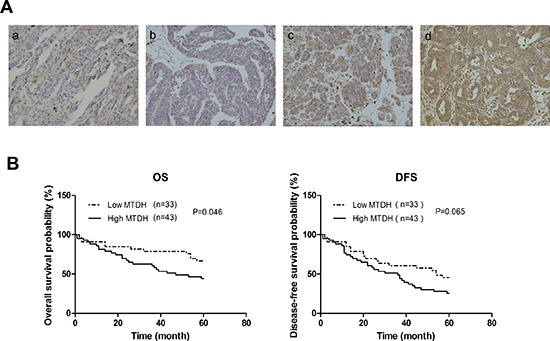
(A) Representative images of immunohistochemical analysis of MTDH expression in HGSOC patients samples. (a: score=0, b: score=1, c: score=2, and d: score=3). (B) Kaplan–Meier plots of overall survival, and disease-free survival for HGSOC patients dichotomized on the basis of high (score 2 and 3) versus low (score 0 and 1) MTDH immunohistochemical expression level.