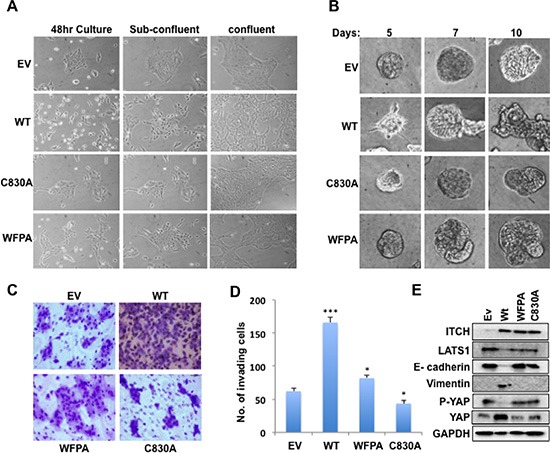
Figure 2. Effect of ITCH expression on EMT in MCF10A cells.

(A) Morphology changes of MCF10A cells expressing either empty vector (EV) or different ITCH forms when cultured in 2D. Images were obtained using inverted light microscope using 100X magnification. (B) Mammosphere formation in 3D Matrigel cell culture of MCF10A cells. Images were obtained using inverted light microscope using 200X magnification. (C) Representative images of Boyden Chamber Matrigel invasion assay of MCF10A cells. (D) Quantification of invading cells in C. (E) Immunoblot analysis showing the effect of overexpressing different ITCH constructs in MCF10A cells on EMT markers. In all figures, error bars represent the standard deviation of three different biological experiments done in triplicates. The statistical significance was measured by calculating the p values for all experiments related to EV; * indicates P value <0.05, **P value <0.01, ***P value <0.001.
