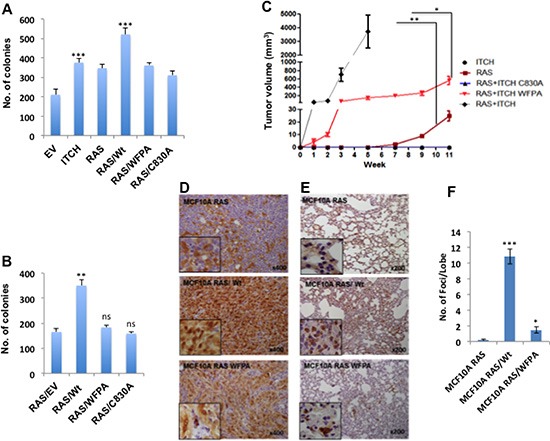
Figure 3. ITCH enhances tumorigenicity of H-RAS transformed MCF10A cells.

(A) Quantification of cell survival rates as assessed by colony formation assays. (B) Quantitative presentation of soft agar assays (Fig S2A) showing cell tumorigenic potential following the expression of the indicated proteins. (C) Tumor growth curve of MFP tumors in Nod-SCID mice injected with MCF10A overexpressing the indicated proteins. (n=6mice/group). (D) IHC staining for YAP in lungs obtained from mice described in C. Brown color indicates positive staining while blue color of the counter stain hematoxyline indicates a negative staining. (E) IHC staining for the RAS downstream effector, p-Erk, on lungs obtained from mice described in C. In all figures, error bars represent the standard deviation of three different biological experiments done in triplicates. The statistical significance was measured by calculating the p values for all experiments comparing ITCH to EV, RAS/WT to ITCH or RAS; * indicates P value <0.05, **P value <0.01, ***P value <0.001.
