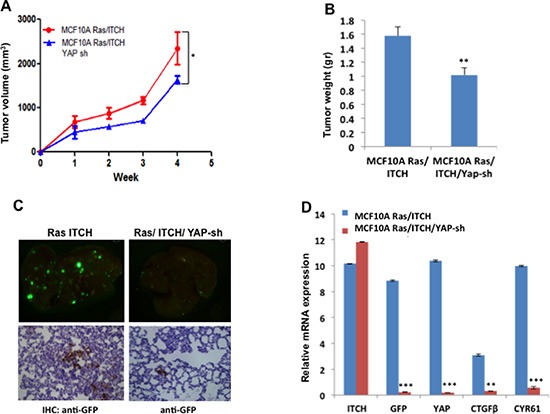
Figure 7. Effect of YAP knockdown on tumor progression in MCF10A cells overexpressing ITCH.

(A) Tumor growth rate curve showing the effect of YAP knockdown on tumor growth; (n=6mice/group). (B) Quantitative presentation of the effect of YAP knockdown on tumor volume. (C) Representative micrographs of lungs obtained from Nod-SCID mice injected orthotopically into MFP with ITCH overexpressing cells or cells overexpressing both ITCH and YAP Sh. Upper panels show metastatic foci of cells constitutively overexpress GFP while lower panels show IHC of lungs using anti-GFP. (D) Relative mRNA expression levels of the indicated genes on RNA obtained from lungs. In all figures, error bars represent the standard deviation of the same experiment made in triplicates. The statistical significance was measured by calculating the p values for all experiments comparing MCF10A Ras/ITCH to MCF10A Ras/ITCH/YAPsh. * indicates P value <0.05, **P value <0.01, ***P value <0.001.
