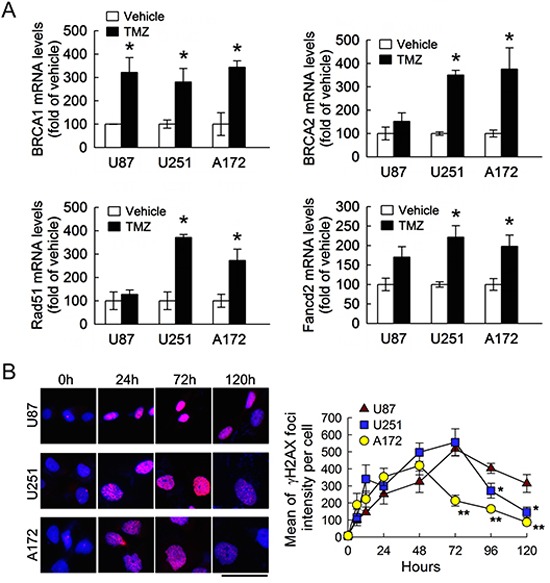
Figure 3. Increase of DNA repair genes and γH2AX foci in glioma cells following TMZ exposure.

(A) Total RNA was isolated from U87, U251 and A172 cells at 48 h after TMZ treatment (200 μM) or vehicle in the medium containing 1% FBS, and then subjected to QPCR analysis for the measurement of DNA repair gene expression indicated as above. Data are means ± SEM of three independent experiments. (B) Representative micrographs show γH2AX foci formation in U87, U251 and A172 cells treated by TMZ. The cells were fixed and stained for γH2AX (red) at different time points post exposure to TMZ and DAPI (blue) was used for nucleus counterstaining (left-handed panel). γH2AX foci intensity with indicated time points was quantified by using ImageJ software. Each time point represents the mean of γH2AX foci intensity per cell from five independent fields in each culture (right-handed panel). Experiments were repeated twice and mean ± SEM were shown. *p < 0.05, versus relative vehicle group (A); *p< 0.05, **p< 0.01, versus U87 (B). Scale bar in B, 50 μm.
