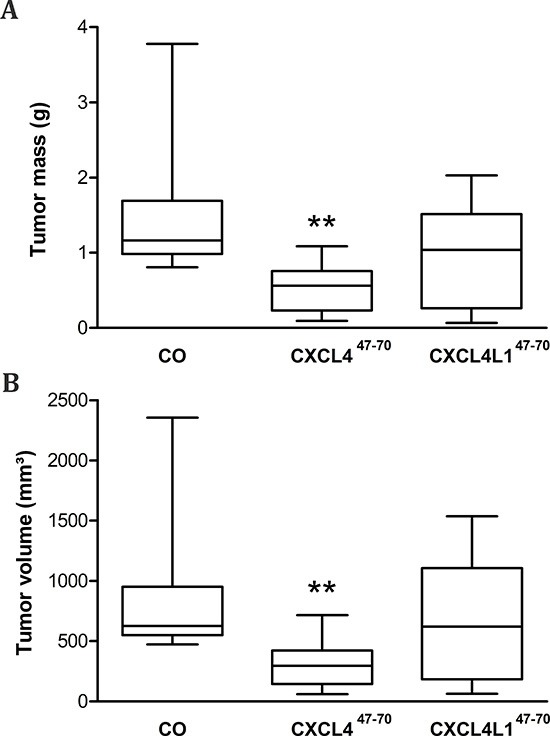
Figure 6. Tumor volume and mass after periodical CXCL447–70 and CXCL4L147–70 treatment.

After vehicle (CO), CXCL447–70 or CXCL4L147–70 treatment (2.5 μg; 3×/week) of MDA-MB-231 tumor-bearing mice, on day 27 or 28 resected tumors were weighed (A) and tumor volumes (B) were determined (4πabc/3 in which a,b and c represent measured radii). Data were depicted as a 5–95 percentile Whiskers plot, in which the horizontal line marks the median value. n=10/group; **p<0.01
