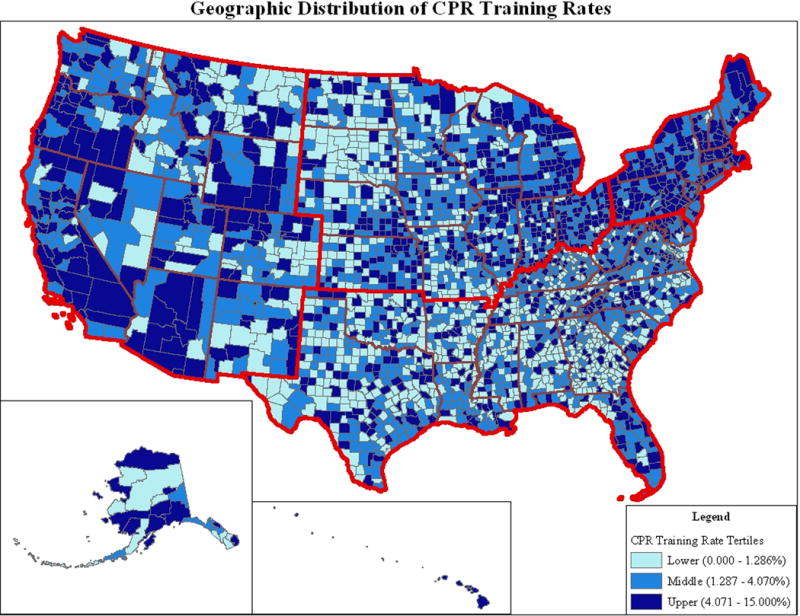
Figure. Geographic Distribution of Counties by CPR Training Tertile in the United States Community CPR Training Cohort.

This map shows the CPR training tertile for each county in the United States. Light blue represents lower tertile counties with CPR training rates ranging from 0.00 to 1.29% (median = 0.39%). Medium blue represents middle tertile counties with training rates ranging from 1.29 to 4.07% (median = 2.39%). Dark blue represents upper tertile counties with CPR training rates >4.07% (median = 6.81%).
