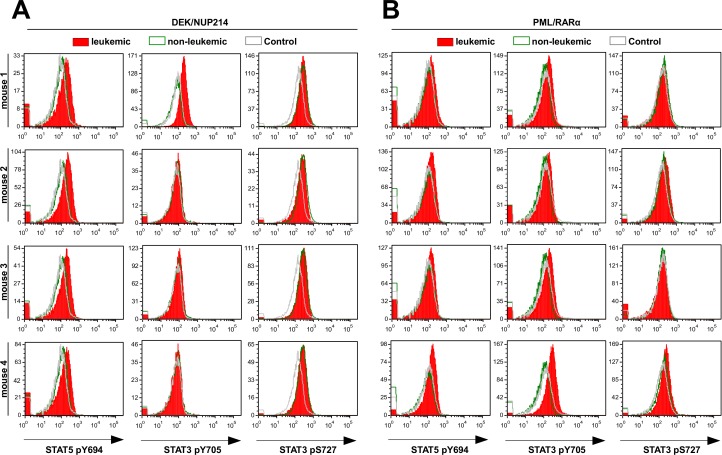
Figure 4. Activation of STAT proteins in leukemic versus non-leukemic AAFP-positive spleen cells.
Activation status of STAT5 (Y694) and STAT3 (Y705 and S727) was analyzed by flow cytometry on freshly thawed leukemic (Flk2-) and non-leukemic (Flk2+) DEK/NUP214-positive (A) and PML/RAR-positive (B) cells (3 × 10⁵ cells per FACS tube) compared to control cells from mice inoculated with empty vector transduced Flk2− cells (Control Flk2-). Histograms show four leukemic mice for each AAFP group. Similarly, 4 non-leukemic and 4 control mice were analyzed. Data from one representative mouse from the later groups is shown.

