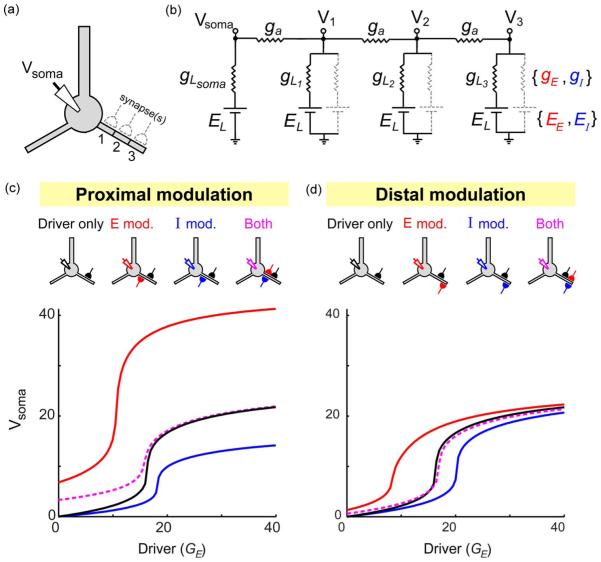
Fig. 5.
Excitatory and inhibitory spatial modulation effects are roughly equal but opposite. (a) Schematic shows neuron with three potential sites of synaptic input. (b) Circuit model with three dendritic and one somatic compartments. Parameters were: gL1 = 10, gL2 = 2, gL3 = 1, ga = 6, EL = −70 mV, EE = 0 mV, EI = −70 mV. Excitatory synapses were modeled as voltage-dependent NMDA-type channels, with gE = GE/(1 + exp(−(Vx + 23:7)/12:5)) where Vx is the voltage at the synapse location. Conductances were in arbitrary units. (c) Schematics of neurons/synapses show an excitatory “Driver” input delivered to mid-dendrite (black synapse), coupled with a proximal excitatory (red) or inhibitory (blue) modulator input, or both. I–O curves are shown for each case (see legend for color code). Excitatory and inhibitory modulator conductances were GE = 40 and gI = 18. The somatic voltage was calculated using the method described in [65]. (d) Similar to (c), but for distal modulation (GE = 60 and gI = 24).

