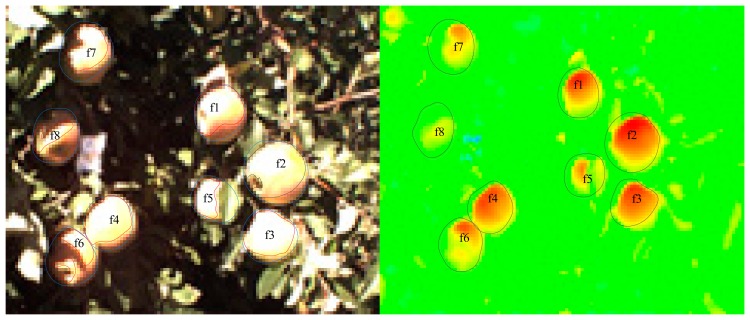
Figure 2.
RGB image (left) and thermal image (right) in the field. In the RGB image, the red region is an estimation of the projected sunlit fruit surface area in the direction of the incident sunlight, (Ad) and the blue region is an estimation of the maximum projected sunlit fruit surface area in the incident sunlit direction (A). In the thermal image, the black region is the fruit region.

