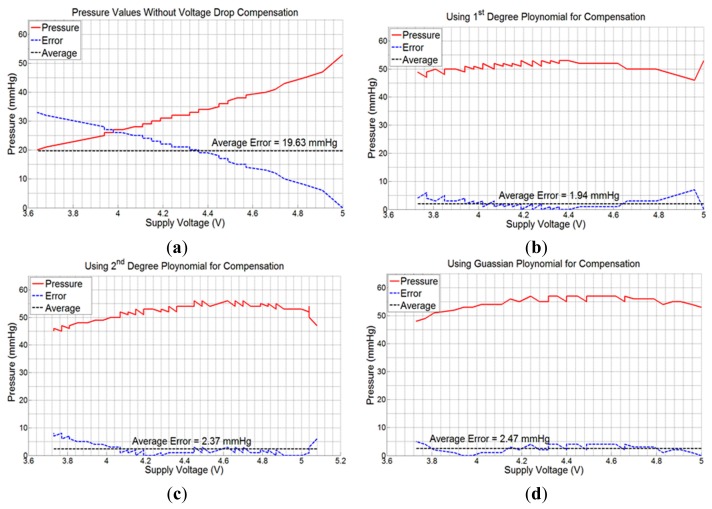
Figure 7.
Graphical plots of measured pressure, error, and average error; (a) without using any compensation algorithm; (b) using 1st degree polynomial in Equation (3); (c) using 2nd degree polynomial in Equation (4); (d) using Gaussian exponential function in Equation (5).

