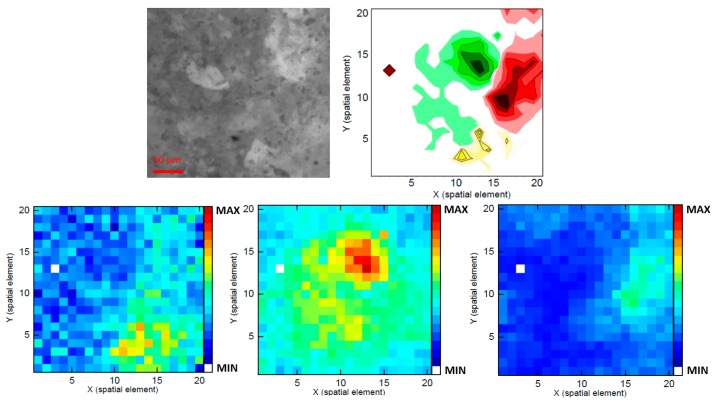
Figure 11.
Sample (III): pain reliever tablet with caffeine, aspirin, and paracetamol. (Upper left) camera image taken with a 20× objective; (Upper right) Overlay of the detected locations of caffeine (yellow), aspirin (green), and paracetamol (red) as contour color illustration. The brown diamond indicates the position of a defective fiber within the probe head. (Lower left) Raman image of caffeine (1703 cm−1); (Lower middle) Raman image of aspirin (1047 cm−1); (Lower right) Raman image of paracetamol (860 cm−1).

