
Figure 4.
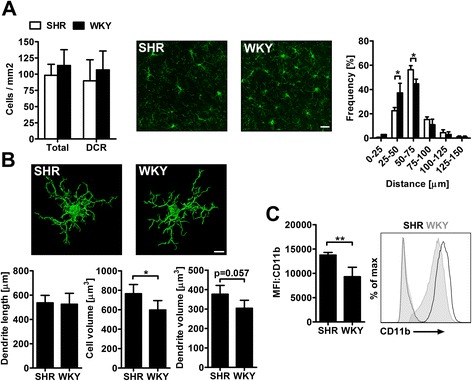
Microglial rarefication and activation in the brain of SHR. Total amounts of Iba1-positive microglia (green) in the total brain and deep cortical region (DCR) did not differ strain-dependently (A). However, distances between adjacent cells were significantly greater in SHR compared to WKY (A). Single cell morphological analysis of microglia within the DCR showed similar dendrite lengths, but increased cell volumes in SHR (B). (C) Mean fluorescence intensities (MFI) of microglial CD11b expression were significantly higher in SHR. The representative histogram illustrates the shift towards increased CD11b expression in SHR. Data are mean ± SD. *p < 0.05, **p < 0.01 by one or two-way ANOVA (A) or t-test (B and C) for n = 4 animals/group, scale bar: 30 μm (A), 8 μm (B).