
Figure 4.
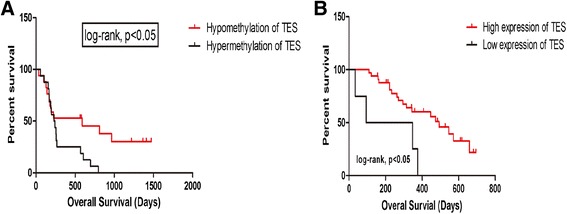
Survial analysis according to TES expression and methylation status. Kaplan-Meier survival estimates of overall survival according to the TES methylation status in 42 GBM patients (A) and according to the TES expression level in GBM patients (B).