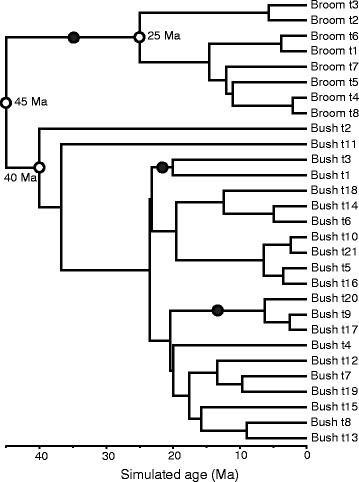
Figure 1.

Example of a simulated chronogram (Tree 1 of 10). Tree parameters were based on those of Xanthorrhoeaceae and were simulated using TESS using a birth-death model, and “broom” and “bush” sister clades. The age of the root was fixed at 45 Ma, that of the broom crown node at 25 Ma, as marked with open circles. DNA sequences were then simulated along the branches of the trees using a GTR + Γ substitution model with slow (broom clade) and fast (bush clade) rates (Figure 2), as in Xanthorrhoeaceae, to test the relative performance of the UCLN and RLC clock models. The simulated trees varied in size from 19 to 42 terminals, and also in the proportion of terminals in the bush vs broom clades, from 31 vs 4 to 6 vs 20. For the BEAST analyses, three log-normal age-calibration priors were used: one was placed on the stem of the broom clade and two were placed on the stem of each of two clades internal to the bush clade (marked with closed circles). The mean and offset of each calibration prior were equal to half the distance between the crown and stem nodes of the respective clade.
