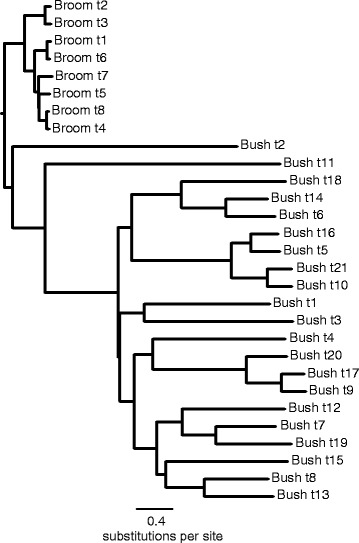
Figure 2.

A maximum likelihood phylogram estimated from DNA sequences simulated on the tree in Figure 1 . We simulated a 1 Kb sequence set using the R package PhyloSim with a GTR + Γ model of substitution (as for Xanthorrhoeaceae), with the alpha parameter set to 1. Substitution rates were modelled by setting the probability of each particular substitution in a Q matrix, with a probability 10 times higher in the bush clade than in the broom clade. See text for the full set of parameter values. Branch lengths are proportional to the substitution rates and illustrate the overall 10x rate difference between the broom and bush clades, and additionally, the stochasticity built into the model. The phylogram was generated in CIPRES using RAxML with a GTR + Γ model.
