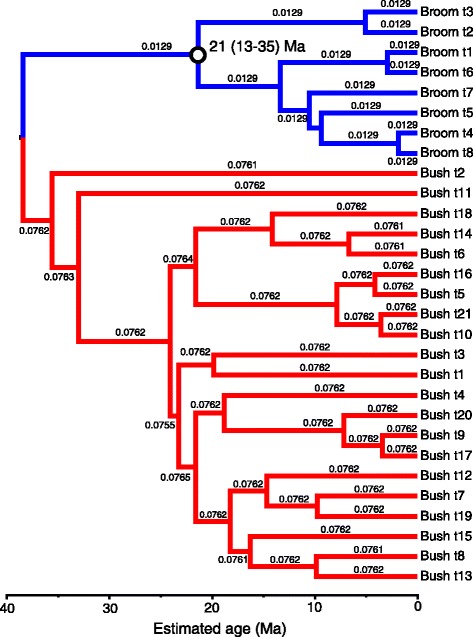
Figure 3.

Reconstruction of the simulated chronogram (Figure 1 ) using BEAST with the RLC clock model and calibration priors as shown on Figure 1 . Each estimate assumed a GTR + Γ substitution model. Branches are colored by inferred local clock rates in the introns partition: red = fast, blue = slow, and each branch is labelled with the estimated rate (substitutions site−1 Myr−1). Estimated age with 95% BCI is shown for the broom crown node (open circle).
