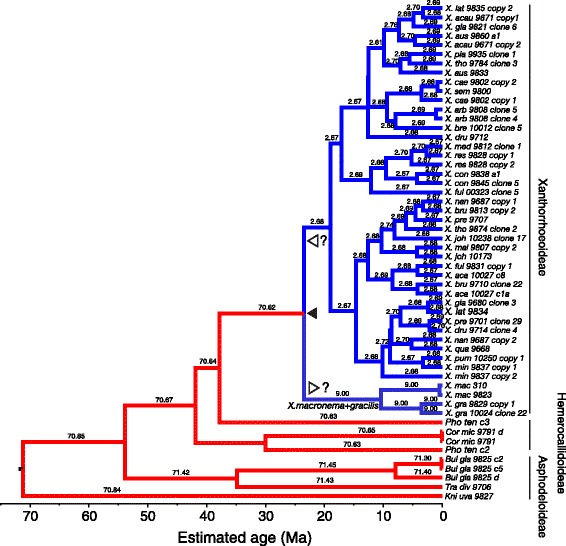
Figure 7.

RLC chronogram of Xanthorrhoeaceae derived from sequences of rpb2 (nuclear DNA). Analysis used BEAST with a Yule tree model. Branches are colored by inferred local clock rates in the introns partition: red = fast, blue = slow, and each branch is labelled with the actual rate (substitutions site−1 Myr−1 × 10⁴). Pointers show the two inferred rate shifts: one downwards in the MRCA of Xanthorrhoeoideae (filled pointer), followed by a second shift (open pointers), which was either a further downward shift in the stem of the large upper clade or a small upward shift in the stem of the X. macronema + X. gracilis clade. The pattern of exon rates and shifts is essentially similar but slower (Additional file 3: Figure S11). Clade labels with bars indicate subfamilies. The scale indicates time before present (Ma).
