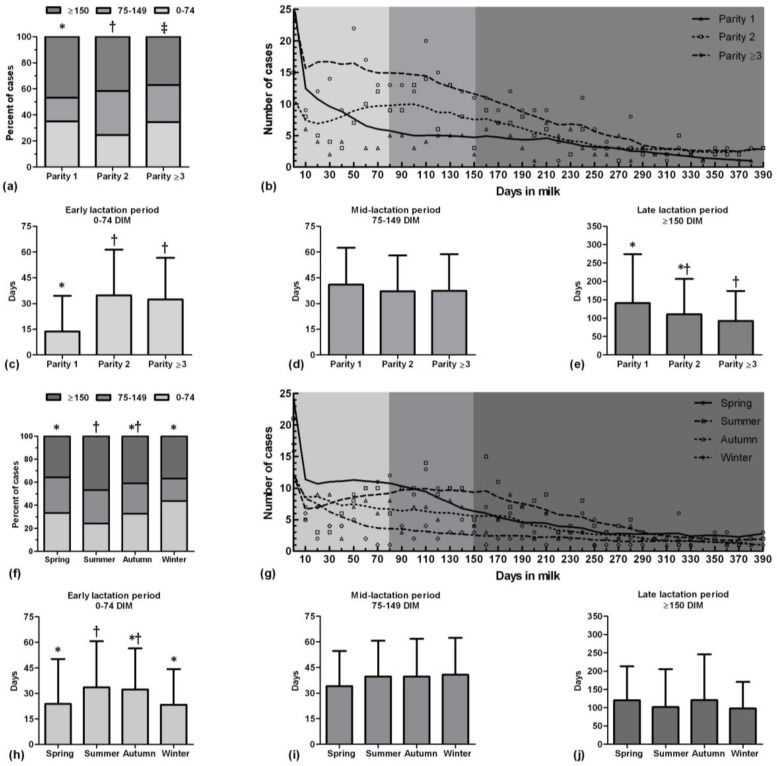
Fig. 2.
Proportion of percent of clinical mastitis cases of different stage of lactation period in different parity (a) and different seasons (f) of Holstein dairy cows; Locally weighted scatterplot smoothing (Lowess) curves of clinical mastitis cases which show the general trend of clinical mastitis incidence during a lactation period in different parity (b) and different season (g); Occurrence time (day) of clinical mastitis in different parity (c, d, and e) and different season (h, i, and j) of each lactation period. Different symbols show significant different between bars (p < 0.05).

