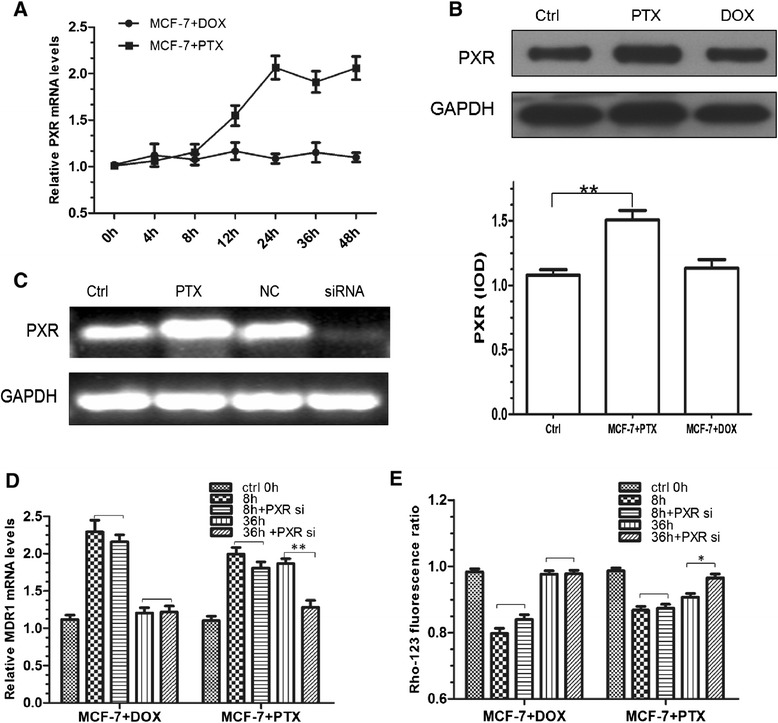
Figure 7.

Impact of PXR activation in DOX and PTX treated cells. (A) PXR mRNA expression with the treatment of DOX and PTX at 0, 4, 8, 12, 24, 36, 48 h. (B) Western blot analysis of PXR with 24 h treatment of DOX and PTX. **, p < 0.01 (n = 3). (C) RT-PCR analysis of PXR mRNA in PTX only (PTX) or treated cells exposed to transfection conditions in the absence of siRNA (mock) or cells transfected with non-targeting (NC) or PXR-specific siRNA (siRNA). (D) Comparison of MDR1 mRNA expression in the cells exposed to transfection conditions with 8 h/36 h DOX and PTX treatment. **, p < 0.01 (n = 3). (E) Rho-123 fluorescence ratio in the cells exposed to transfection conditions with 8 h/36 h DOX and PTX treatment. *, p < 0.05 (n = 3).
