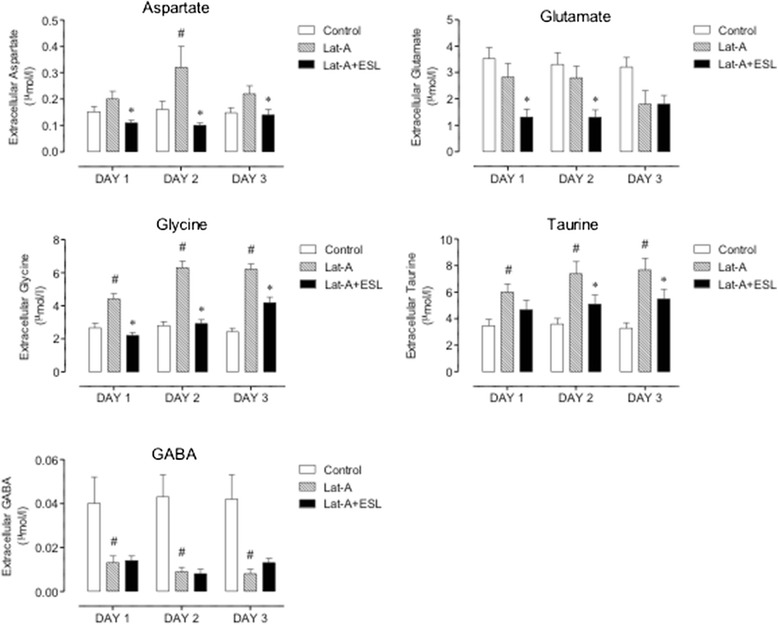
Figure 5.

Extracellular aminoacid concentrations in control mice, after latrunculin A, and latrunculin A and ESL (100 mg/kg). Columns represent mean values of 8 animals per group; vertical lines indicate SEM. Significantly different from corresponding values in control (# P < 0.05) or latrunculin A-treated mice (*P < 0.05) using the two-way ANOVA followed by Holm-Sidak’s multiple comparisons test.
