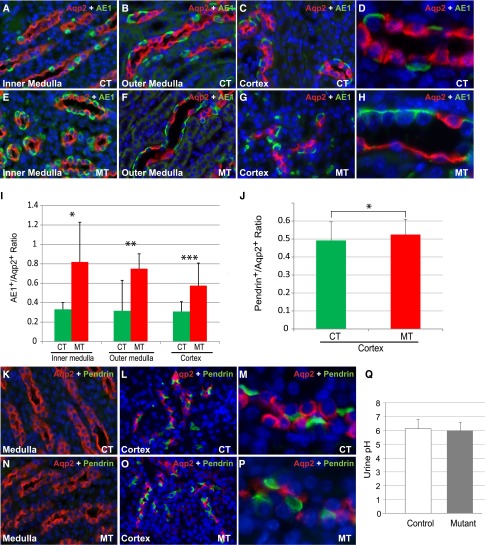
Figure 3.
Adam10 inactivation affected type A intercalated cells more than type B intercalated cells but did not affect urine pH. In adult controls (A–D) and mutants (E–H), immunofluorescence staining showed PCs (Aqp2+) and type A ICs (AE1+) in inner medulla (A and E), outer medulla (B and F), and cortex (C and G). (D and H) Higher-magnification images of medullary collecting ducts. The ratio of type A ICs/PCs increased significantly in the inner medulla, the outer medulla, and the cortex in mutants (0.82±0.41, 0.75±0.15, and 0.57±0.23, respectively) compared with the controls (0.33±0.07, 0.31±0.06, and 0.31±0.10, respectively; P<0.001 in all three regions) (I). Immunofluorescence staining of Aqp2 and Pendrin in the adult medulla (K and N) showed essentially no Pendrin+ cells in either genotype. In the cortex of adult controls (L and M) and mutants (O and P), the relative ratio of Pendrin+ type B ICs/PCs was only moderately higher in mutants (0.52±0.09) than in their control littermates (0.49±0.10) (P=0.02) (J). The urine pH did not significantly differ between mutants (6.0±0.6) and controls (6.1±0.7) (Q). CT, controls; MT, mutants. Original magnification, ×20 in A–C, E–G, K, L, N, and O; ×60 in D, H, M, and P.

