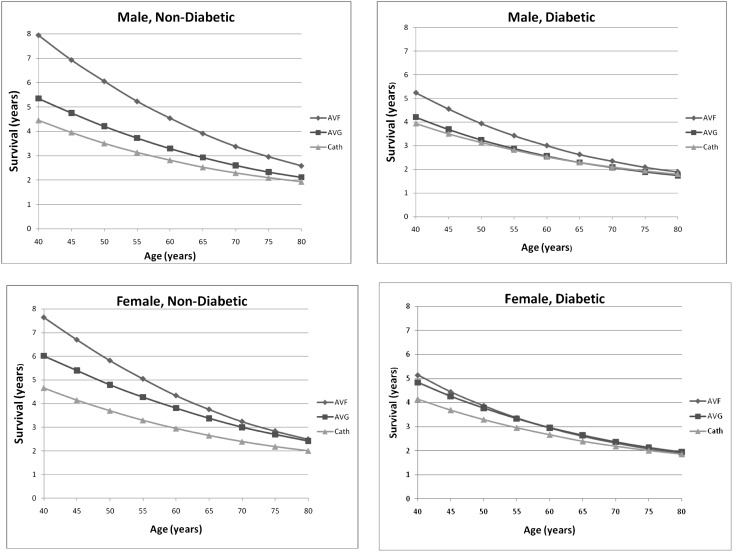
Figure 2.
Patient survival by access attempt strategy. Plots are stratified by sex and diabetes status. The x axis represents the age in years of modeled patients. The y axis represents the survival in years for modeled patients. Patient survival in years by age stratified by sex and diabetes status. AVF, AV fistula; AVG, AV graft; cath, CVC.

