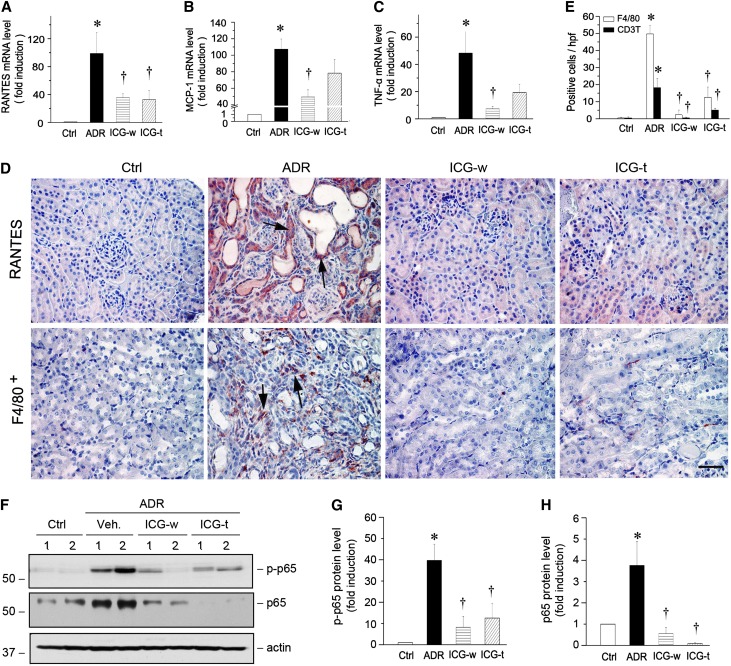
Figure 8.
ICG-001 inhibits inflammatory cytokines expression and reduces renal infiltration of macrophages in ADR nephropathy. (A–C) Quantitative real-time RT-PCR shows renal mRNA levels of (A) RANTES, (B) MCP-1, and (C) TNF-α in different groups. *P<0.05 versus normal controls; †P<0.05 versus ADR alone (n=5–6). (D) Representative micrographs show renal expression and localization of RANTES and F4/80 antigen in different groups. Paraffin-embedded kidney sections were stained with RANTES and F4/80 antibodies. Arrows indicate positive staining. Scale bar, 50 µm. (E) Graphic presentation of F4/80+ macrophages and CD3+ T cells in the kidney sections. Data are presented as the numbers of positive cells per high-power field (hpf). *P<0.05 versus normal controls; †P<0.05 versus ADR alone (n=5–6). (F) Western blot analyses show the active phosphorylated p65 (p-p65) and total p65 expressions in vivo. (G and H) Graphic presentations show the (G) p-p65 and (H) p65 protein abundances in different groups. Relative protein levels over the controls (fold induction) are reported. Ctrl, control; Veh, vehicle. *P<0.05 versus normal controls; †P<0.05 versus ADR alone (n=5–6).

