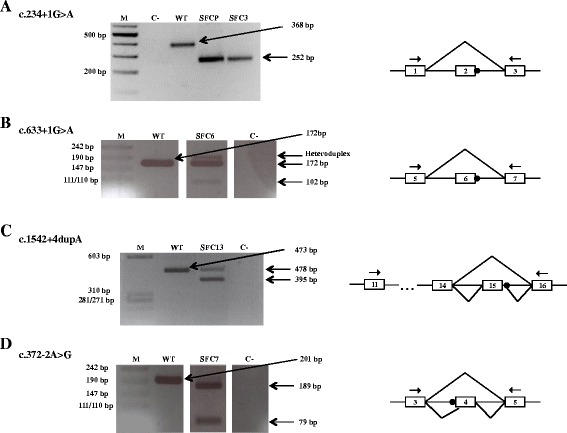
Figure 1.

Analysis of alternative HGSNAT transcripts from the mRNA of five MPS IIIC patients by RT-PCR. RT-PCR amplification of mutations c.234 + 1G > A (A), c.633 + 1G > A (B), c.1542 + 4dupA (C), and c.372-2A > G (D), and of the WT allele, using the primers indicated in the schemes by arrows. The different splicing patterns are depicted in the schemes (right), in which the mutations are indicated by black circles. M: marker, C-: negative control, SFCP, −3, − 6, −13, −7: patients. Boxes in the schemes correspond to exons.
