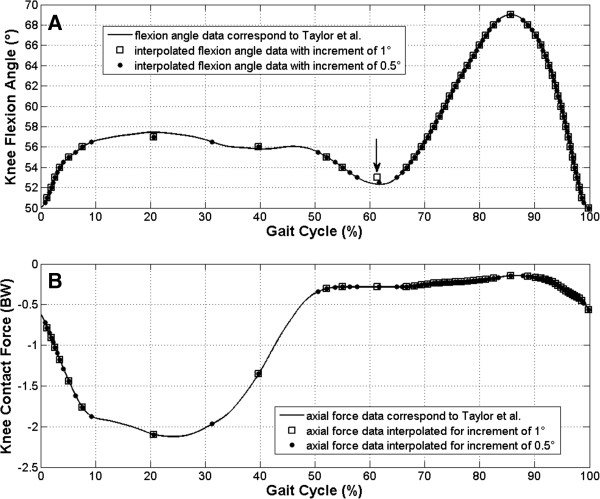
Figure 2.

Data interpolation for the robot. In order to program the robot movement, knee flexion data were interpolated for the robot (diagram A, points and squares) using the flexion data from Taylor et al. [11] (diagram A, solid line). If two adjacent, interpolated points at local minima or maxima had the same flexion angle, the midpoint (square in diagram A marked with a black arrow) was taken instead of both points (for more information, see the text). Interpolation of axial force data (diagram B, points and squares) was performed using the axial force data from Taylor et al. [11] (diagram B, solid line) in accordance with the gait cycle data of the interpolated incremental flexion (diagram A, points and squares).
