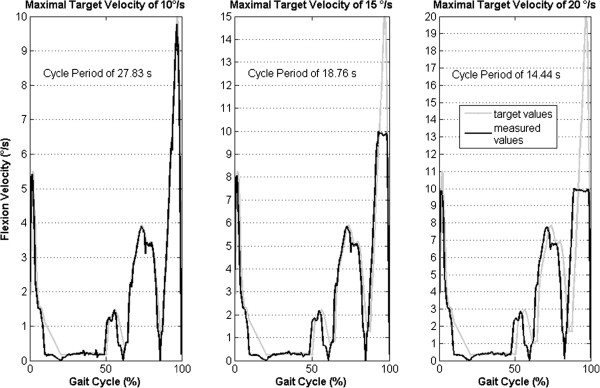
Figure 4.

Flexion velocity profiles above the 10°/s limit. Knee flexion velocity curves (black) were measured during the simulation of the gait cycle with three different target velocity profiles. The target velocity profiles were calculated for maximal values of 10, 15 and 20°/s (gray curves).
