Figure 2.

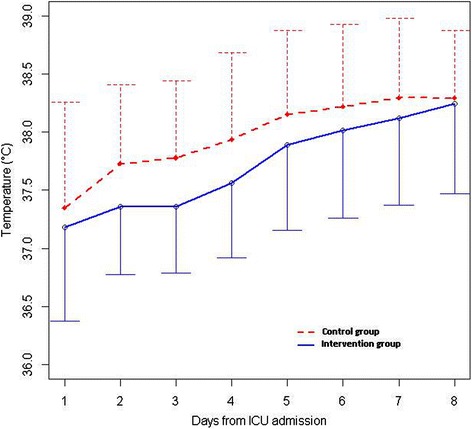
Mean daily body core temperature curves for the first eight days of ICU stay. Upper (dashed line) and lower (dark line) limits of standard deviation are displayed for the control group and the intervention group, respectively.

Mean daily body core temperature curves for the first eight days of ICU stay. Upper (dashed line) and lower (dark line) limits of standard deviation are displayed for the control group and the intervention group, respectively.