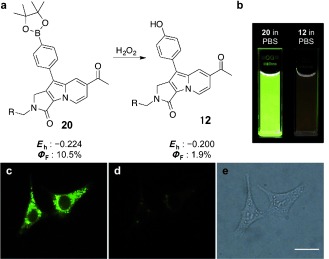
Figure 2.

Structural change from 20 to 12 and change in the quantum yield upon the addition of H2O2, and cellular fluorescence images of 20‐treated HeLa cells before and after treatment of H2O2. a) Correlation of the quantum yield with the HOMO energy level of 20 and its counterpart 12. b) Photographic images of 20 and 12 in phosphate‐buffered saline (PBS). c) Fluorescence image of HeLa cells upon treatment with 20. d) Fluorescence image of the same 20‐treated HeLa cells after the addition of 1 % H2O2. e) Bright‐field image of (d). Scale bar is 20 μm.
