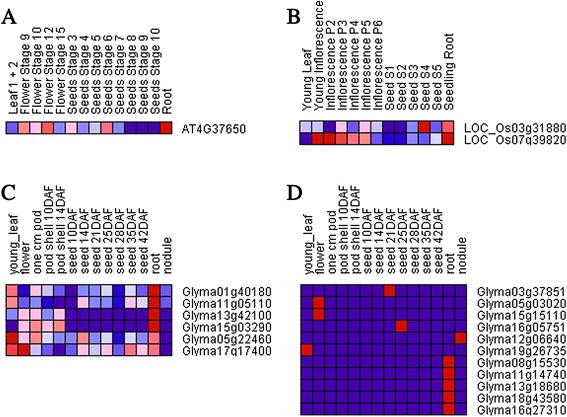
Figure 3.

Expression profiles of Arabidopsis , rice, and soybean GRAS genes. According to the hierarchical cluster color code, the largest values are displayed as the most red (hot), the smallest values are displayed as the most blue (cool), and the intermediate values are lighter shades of blue or red. A, B, and C show that 9 GRAS genes clustered together in the tree have a similar preferential expression in the root. D shows the tissue-specific genes in soybean.
