
Figure 1.
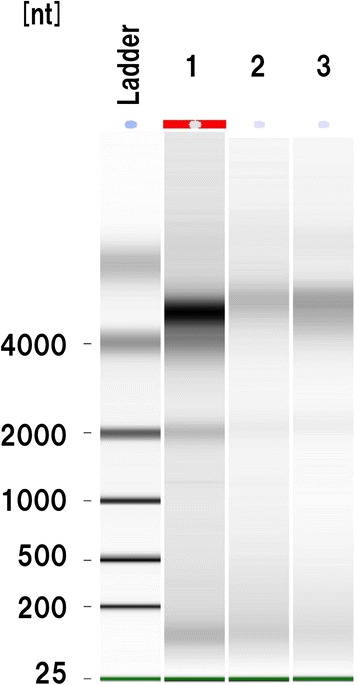
Effect of formalin fixation on RNA expression. Representative RNA agarose gel image showing a band of 2000 nt corresponding to 18S ribosomal RNA in lane 1. A faint band of 2000 nt is also seen in lanes 2 and 3. Lane 1, sample 2; lane 2, sample 1; lane 3, sample 8.