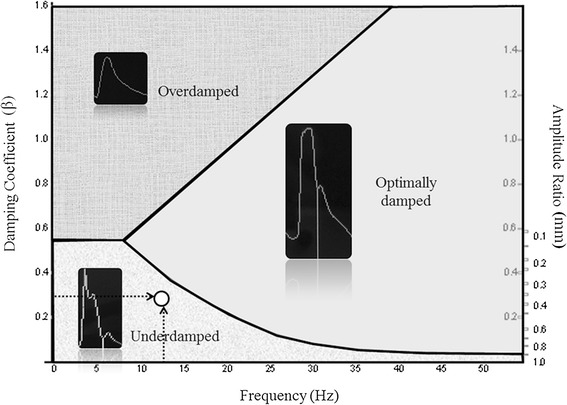
Figure 3.

Diagram showing the three areas for underdamped, overdamped, and optimally damped blood pressure signal. The black arrows indicate the natural frequency and the damping coefficient of the example showed in Figure 2. The white point identifies an underdamped/resonant arterial pressure signal.
