Figure 4.

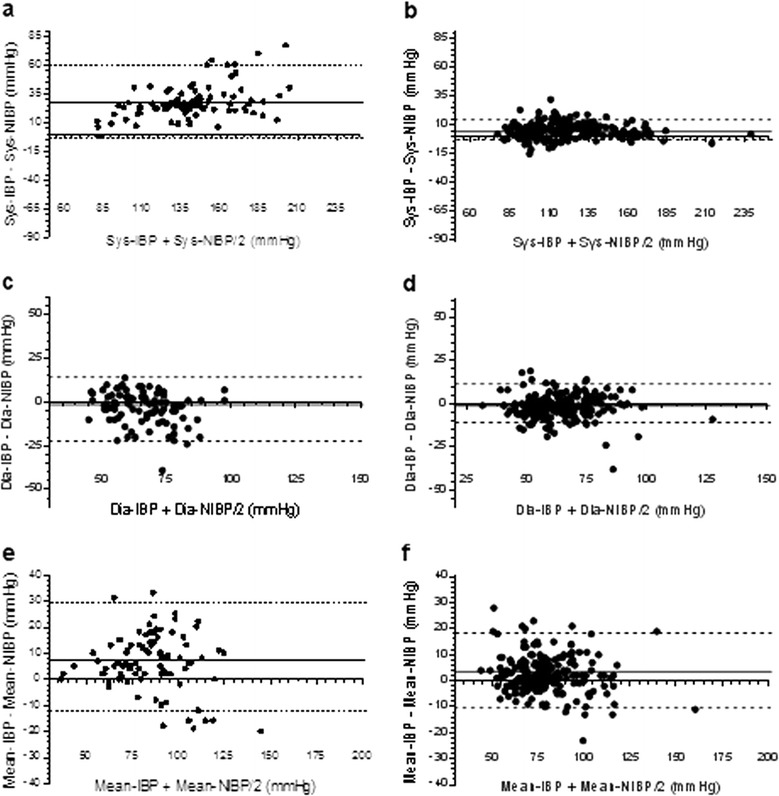
Bland-Altman plots in the resonance (R-group) (a, c, e) and the non-resonance (NR)-group (b, d, f). Sys, systolic; Dia, diastolic; IBP, invasive blood pressure monitoring; NIBP, non-invasive blood pressure monitoring.

Bland-Altman plots in the resonance (R-group) (a, c, e) and the non-resonance (NR)-group (b, d, f). Sys, systolic; Dia, diastolic; IBP, invasive blood pressure monitoring; NIBP, non-invasive blood pressure monitoring.