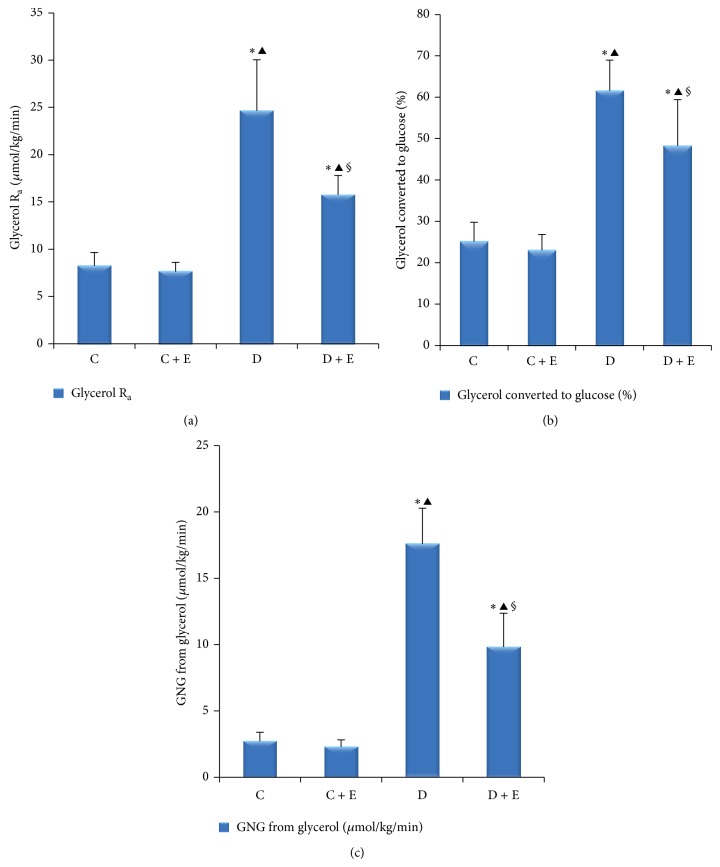
Figure 3.
Plasma parameters of glycerol flux and gluconeogenesis. C: nondiabetic, control; C + E: nondiabetic + exenatide; D: diabetic; D + E: diabetic + exenatide. Ra means appearance rate; GNG means gluconeogenesis. Data are presented as mean ± SD. * P < 0.01; # P < 0.05 compared with C group. ▲ P < 0.01 compared with C + E group. § P < 0.01 compared with D group. Glycerol appearance after an overnight fast was lower (P < 0.01) in the D + E group rats than that in the D group rats (a). The gluconeogenesis from glycerol, such as glycerol converted to glucose (%) and gluconeogenesis from glycerol, was clearly lower (P < 0.01) in the D + E group rats than that in the D group rats. (b and c). * P < 0.01, # P < 0.05 compared with basal. β P < 0.01, α P < 0.05 compared with C group. σ P < 0.01, γ P < 0.05 compared with C + E group. § P < 0.01, φ P < 0.05 compared with D group.

