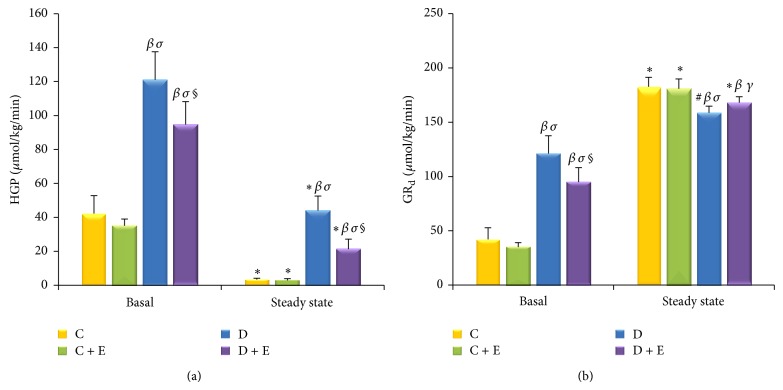
Figure 5.
HGP and the disappearance rate of glucose (GRd) during the hyperinsulinemic-euglycemic clamp steady state. HGP following an overnight fast was higher (P < 0.01) in the D group rats than that in the D + E group rats. During clamp steady state, HGP was greater (P < 0.01) in the D group rats than that in the D + E group rats (a). In the basal state, the D + E group rats had a lower GRd than the D group rats (P < 0.01). The C + E group rats also had a lower GRd than the C group rats, but this was not significantly different (b). Under the clamp steady state, the GRd of the D group rats was lower than that of the C group rats (P < 0.05) and that of the C + E group rats (P < 0.01). The GRd of the D + E group rats was also significantly lower than that of the C group rats (P < 0.01) and that of the C + E group rats (P < 0.05). There was no significant difference found between the C group rats and the C + E group rats (P > 0.05) (b). * P < 0.01, # P < 0.05 compared with basal. β P < 0.01, α P < 0.05 compared with C group. σ P < 0.01, γ P < 0.05 compared with C + E group. § P < 0.01, φ P < 0.05 compared with D group.

